Treasure Talk with Bob Evans, News, Rare Coin Articles
Treasure Talk: Episode 12 Part 1 – Identifying The Shipwreck
Feb
Treasure Talk: Episode 12 Part 1 – Identifying The Shipwreck
In the Hollywood version of a generic shipwreck story, a diver finds an artifact with the name of a ship, identifying the discovery as the site of untold riches. Or they see the name still painted on the bow, or on a life ring still lashed to the wreckage.
It is not always that simple…
Our project to find the S.S. Central America made mistakes, because, to err is human. Bias can creep into analysis in all sorts of ways. In my experience, wishful thinking is fertile ground for hasty conclusions. Sometimes, it takes a long time to recognize the blunders. With good fortune, corrections can be made.
1986 marked the beginning of our at-sea operations, beginning with a sonar search of a vast area of the deep ocean, starting 150 miles off the southeast US coast.
In 1986, I was without any experience at sea. At the age of 32 my maritime highlights were crowned with a 24-inch walleye caught during a chartered daytrip on Lake Erie. (Nice fish.) Bobbing around for hours on a 30-foot fishing boat taught me that I did not get seasick, at least not easily.
I was game for getting involved with the at-sea ops, but I knew nothing much about side-scanning sonar, and our initial search expedition involved a sonar survey of a broad swath of ocean. Pursuing my geology degree, where I directed my studies toward sedimentary rocks and fossils, I gained peripheral knowledge of many types of geophysical surveys, mostly focused on magnetic features, minor variances in gravity, or setting shocks and explosions to measure seismic response, using tools to look deep within the earth. Sonar was most useful for detecting and mapping surface features on the seabed, not something I studied except to become familiar with basic principles.
A side-scan sonar survey consists of towing a hydrodynamic torpedo-like “fish” that chirps or pings at two different frequencies, to distinguish the returns from the areas to one side or the other of the towed transceiver (it both sends and receives the signals.)The SeaMARC 1A unit, newly designed, developed and operated by Williamson and Associates from the Seattle area, was our fish designated for the 1986 survey to commence in June. This unit emanated pings at 30khz and 28khz, rather low frequencies designed for broad-swath coverage of a path three miles (5,000 meters) wide. With sonar, higher frequencies produce finer detail in the returns, while lower frequencies can reveal features at greater distance but with fuzzier detail.
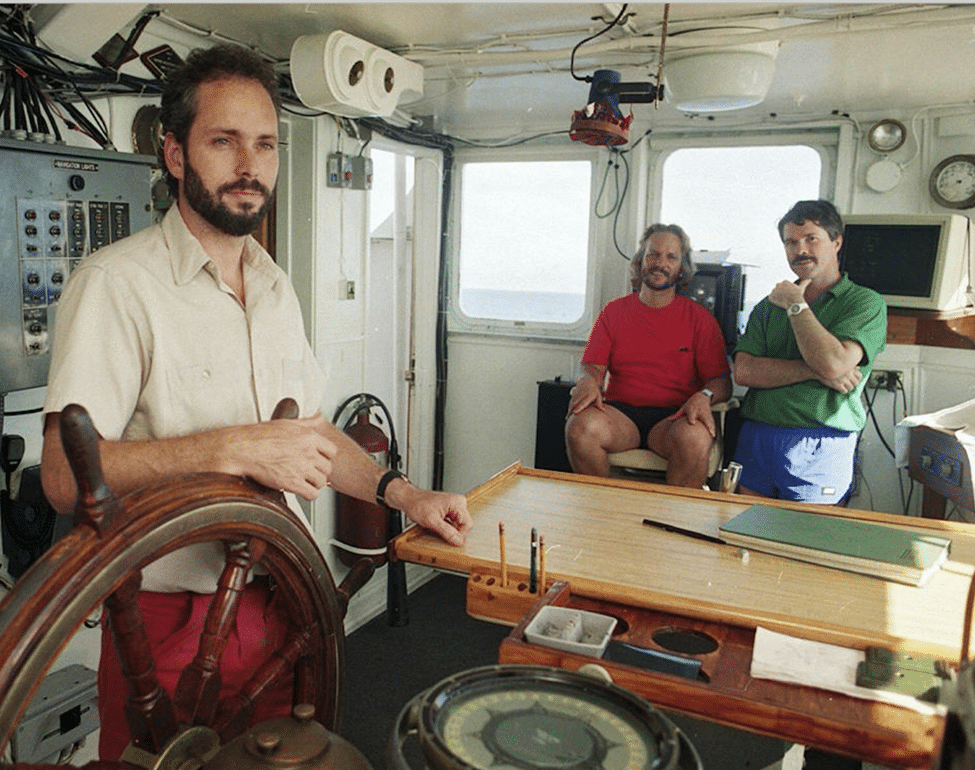
Three of us comprised the core of the Project’s early “Home Office” in Columbus. Project founder Tommy Thompson and I were joined by Tommy’s friend from high school, Barry Schatz. Barry was our communicator, writing Tommy’s letters to his investment partners, and assuming the role of a second company spokesperson. Tommy’s thoughts didn’t always coalesce into words understandable to “normal people.” So, Barry translated Tommy for the investors and the wider world. Often, I had to translate Tommy for Barry, the scientific and engineering jargon and concepts being nebulous or obscure, and sometimes fanciful.
Here are the three of us, on the bridge of our ship a few years later, in 1989.
Tommy cajoled a neighborhood acquaintance to rent us spare space in his home. Jim was an attorney and a bachelor, and he had too much room in his sprawling, Victorian near-mansion on gentrifying Neil Avenue in Columbus. His house was well-appointed, with oaken interior frames, moldings, and mantlepieces, an appropriate setting for Tommy to host two or three investors at a time in the front room, in which we fashioned a sort of a business parlor. Jim gave us lots of space, although eventually friction developed between Tommy and him. I established my office in the second-floor front room, with a picture window overlooking the tree-lined avenue.
I was focused on assembling all the historical and scientific information that might be needed during the upcoming sonar survey. During this same period, I met Jane, and I was smitten. I decided to stay in Columbus and be the Home Office “staff of one” during the planned 40-day survey by Williamson & Associates. I missed a few weeks of experience at sea, but 40 years later Jane and I are still together.
I would receive faxes from the ship, usually daily. Much of the communication had to do with coordinating supplies with Bob Hodgdon, our onshore logistics guy. Hodgdon and I were “the Bobs.” We became known as Log Bob and Info Bob (the first of several nicknames given to me over the past 4 decades.) There were major issues with the initial supplies. Hodgdon was dealing with offshore issues on a coast with no offshore industry except fishing.
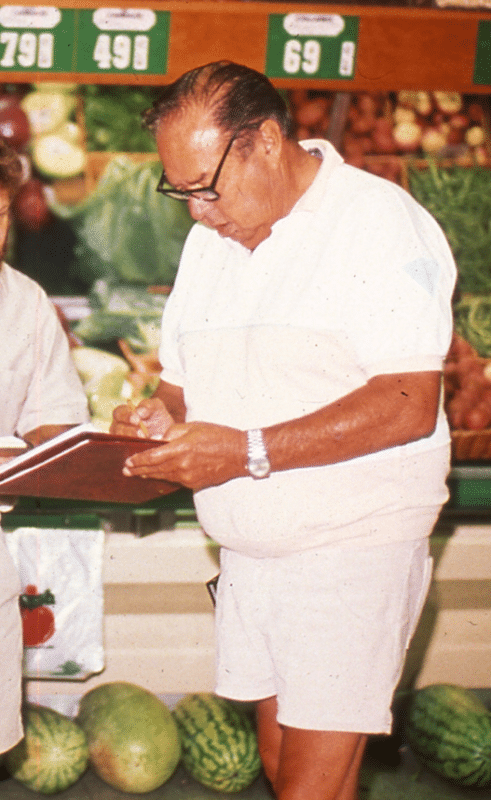
Log Bob (Bob Hodgdon) buying groceries – a most important function!
This was not Bob Hodgdon’s first rodeo. He was a WWII veteran, serving in the wartime Merchant Marine, on Liberty Ships supplying the European theater. Multiple times, convoys in which he served were attacked by U-boats. In the 50’s, he was part of a team using sophisticated Zeiss telescopes (acquired from the Germans during the post-surrender occupation) to track the flights of ICBM tests in the Pacific atolls. Later, in 1974, he served in some logistical capacity during the Howard-Hughes-backed, top-secret, CIA recovery of the sunken Russian nuclear submarine K-129 from the extremely deep Pacific seabed, over 17,000 feet deep.
This operation is legendary in deep-sea circles. It was also incredibly expensive, hundreds of millions of dollars, billions in today’s dollars, backed at least partially by Hughes’s fathomless pockets. But it was an amazing Cold-War intelligence coup. Secrecy had been absolute! It was a “mining test” for deep-sea manganese nodules, and the cover story worked. The Russians never found out we had their sub until well after the operation. In my experience, Bob wouldn’t talk about it, except to say that they should never have talked about it.
He was perfect for our own top-secret project. He knew every place to acquire everything the expedition might need, from technical gizmos to watermelons. His demeanor was congenial, like somebody’s affable old grandfather, a role he also enjoyed.
I talked with Log Bob almost every day. He was headquartered in Charleston, where the leased M/V Pine River was fitted with the sonar and handling equipment and prepared for the survey. The Pine River’s regular business was as a Gulf Coast oil industry “Mudboat.”
These small ships ferry personnel and supplies to the oil rigs, the giant platforms miles offshore from Louisiana and Texas. In large tanks they carry the all-important “mud,” a dense fluid that is injected into the drill string and suspends the rock chips ground up by the drill bit, which can then be pumped back out of the hole, making room for continued drilling. It’s complicated; you don’t just stick a straw in the hole and suck.
So, Gulf Mudboats were a class of small working ships we could adapt for deep-sea survey, consisting essentially of a forward house with a long, open working deck aft where equipment could be mounted, modifying the ship for almost any purpose, in our case including a winch and a towpoint for survey. For the first two years of the project, we leased mudboats, the Pine River from Houma, LA in 1986 and the Nicor Navigator from New Orleans in 1987.
The technical crew from Williamson and Associates knew what to expect, a survey lasting up to 40 days. The Pine River and its crew were not at all accustomed to such an arrangement. Trips to the rigs were usually just a few days at most.
The cook had stored enough food for just a week or 10 days and had no intentions of staying longer; a lot of frozen chicken I heard. Then the fishing boat Log Bob found to resupply the ship got lost on the 165-mile trip out. There were issues, but the tech team persevered with the survey.
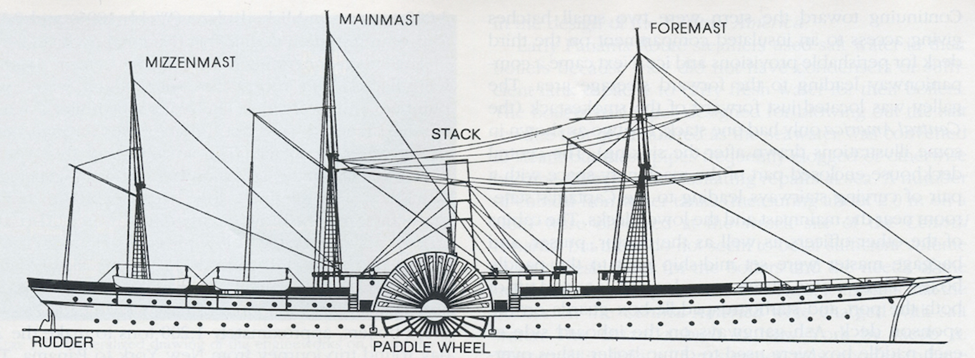
While they were at sea, there were a few technical questions for me. Tommy was careful about the scientific process, so he didn’t always explain why he asked about something. I remember one question in particular, “How many masts did the Central America have?”
I explained the sail plan. They started out with three masts, an arrangement known as “barkentine rigging,” with a square-rigged foremast, and fore-&-aft-rigged mainmast and mizzenmast. When it sank it had only the mainmast amidships and the mizzenmast astern, since the foremast had been cut away during the hurricane, in a failed attempt to head the crippled steamship into the waves, instead of being pounded in the troughs.
So, the simple answer was, three masts when the ship was operational, two masts when it sank.
No additional inquiry about the masts was forthcoming, but Tommy was clearly excited about something.
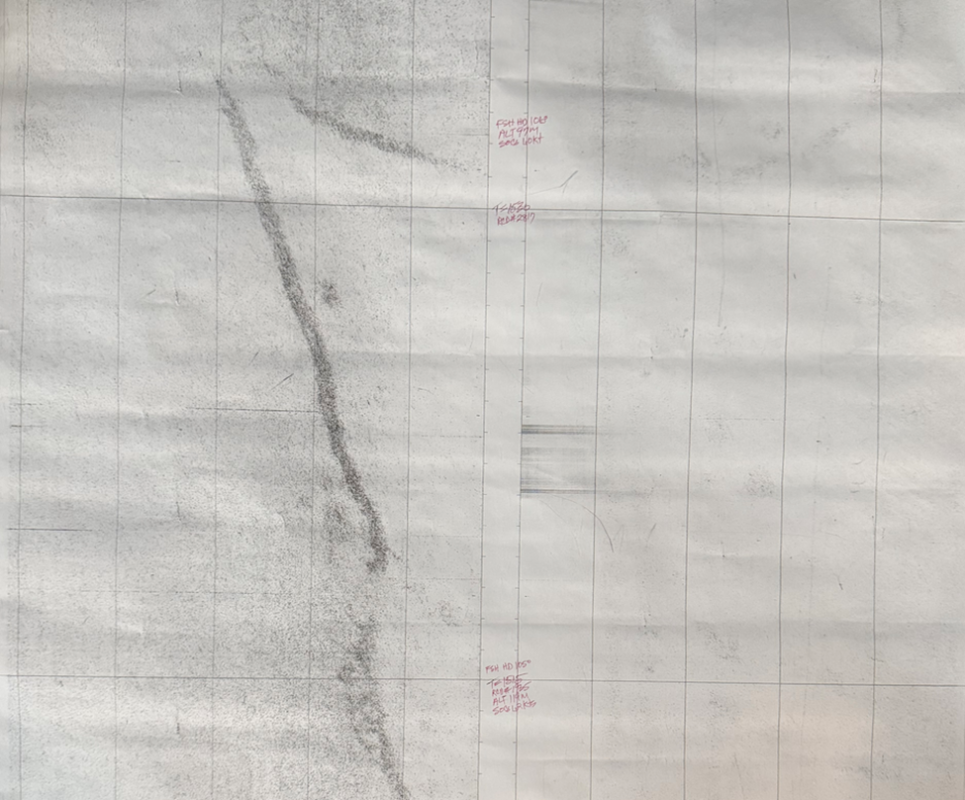
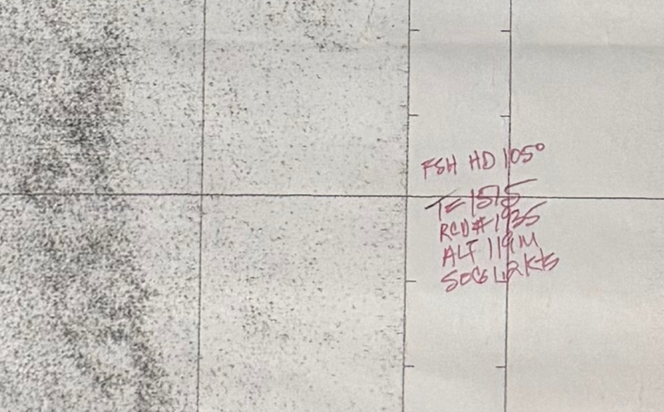
After the expedition concluded, I joined the ship at the port in Charleston for a couple weeks, to learn about the sonar records and the newfangled “image processing” of the “digitized data.” The mid-80s marked a transitional period for sonar records. Previously, the data was captured mostly on EPC. I could be wrong, but I recall this stands for something generic, like Electronically Printed Chart. That is the principle. The returning sonar signals activate an electronic stylus which then imprints one of 16 different gray tones to a 20-inch-wide scroll of electro-thermal paper. This was the standard for decades.
Here is an example EPC mapping a sinuous geological anomaly along the port side (to the left) of its track.
With the dawn of the computer age, this evolved. EPC was simple, well-known, and relatively cheap. But greater resolution and automatic integration of the data were obvious improvements. Many other features could be teased out by recording 256 incoming signal levels, captured digitally, than what could be depicted in 16 gray tones and manuscript notes.
Williamson & Associates had a crewmember, Scott Lafferty, from the Seattle area who had worked extensively with the sonic equipment involved in the fishing industry, echo sounders and “fish-finders.” Scott had an image-display program that could easily adapt to the most sophisticated side-scan sonar yet built, the SeaMARC 1A, and the data could be displayed on a modified desktop IBM XT.
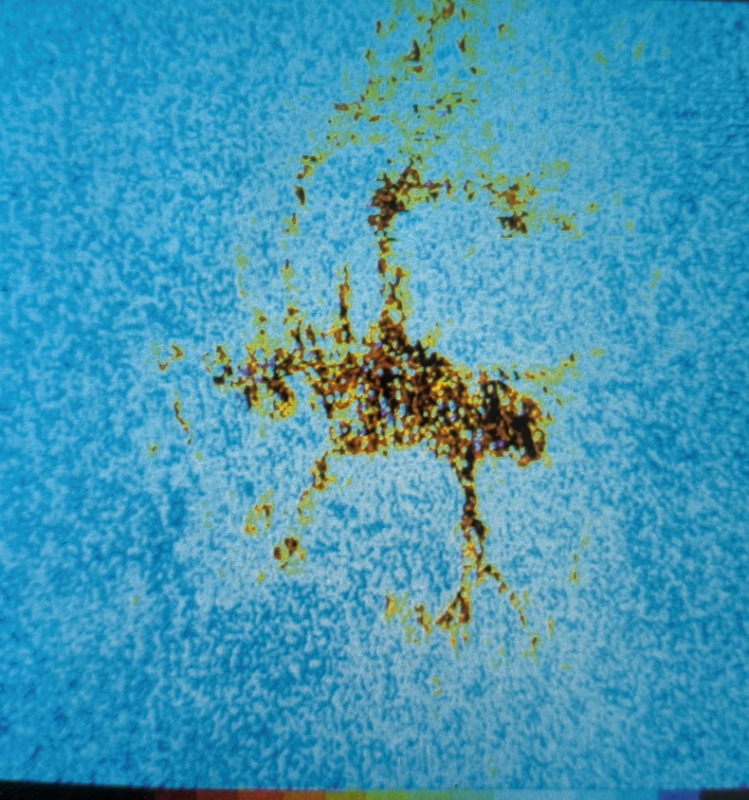
Here is a typical sonagram showing one of the shipwrecks imaged in 1986. It represents a smaller, unidentified “boat” that we never visited with our cameras. This was obviously not the SSCA, but it nicely illustrates the nature of features displayed by that system.
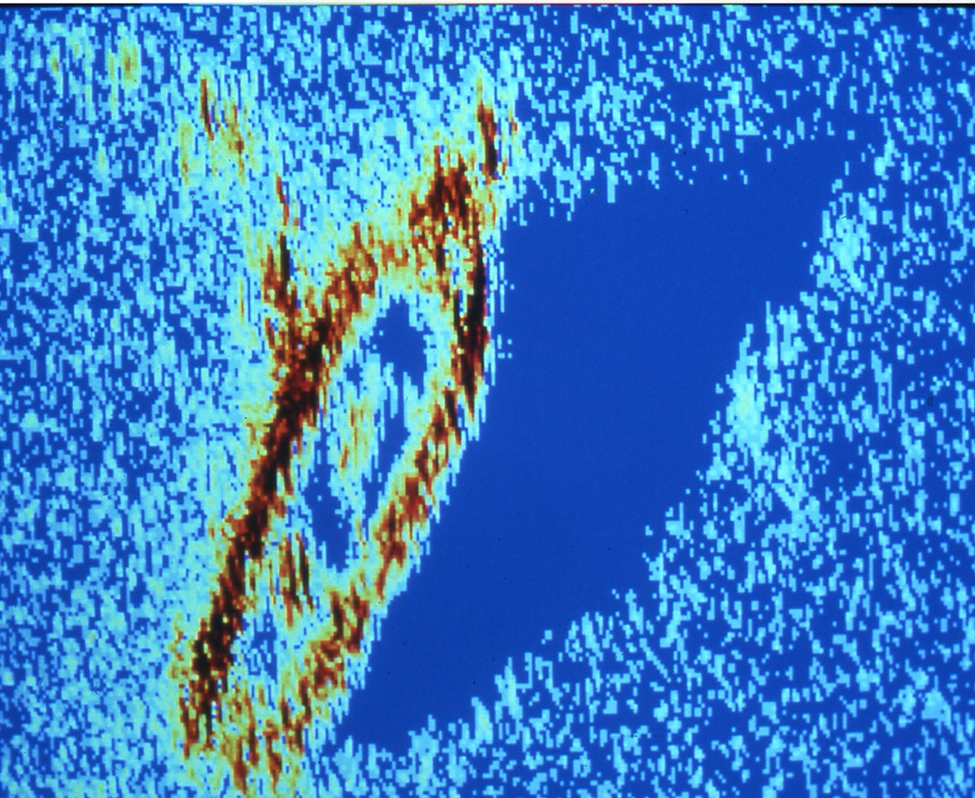
The shape of the ship is obvious with the hull outline marked by strong echoes (the yellows, reds, and black) well above background (the light blues.) The sonic shadow is obvious, the dark blue indicating a void of echoes, a return less than the regular seabed. We can see from this shadow that this boat has not degraded to a significant degree, and the hull still projects up into the water column to cast the shadow. I don’t have the data for this image at hand, but if we also knew the fish altitude above the bottom and the distance from the fish, we could confidently estimate how tall it stands above the bottom. (Trigonometry – high school math.)
After they had concluded the survey, I joined Scott Lafferty at the ship in Charleston to learn the system that I used extensively for the next couple years.
I saw what had them excited.
Our search plan had been guided by thorough historical research and sophisticated math. Encompassed within the highest probability area (essentially the “bullseye”) the survey had imaged an anomaly that looked very much like a sidewheel steamship. Transoceanic sidewheel steamships were a product of only a 30-year period, and only three had sunk in deep water, far off the southeast US coast: the Evening Star (a hurricane in October 1866,) the Daniel Webster (the same storm,) and the Central America, nine years earlier.
The SeaMARC 1A sonar could switch from tracks covering 5,000 meter swaths to higher resolution passes of 1000m or 500m, without retrieving the fish to the ship to adjust the electronics.
This saved a lot of time, since the fish trailed the survey vessel by 3 miles or so when under broad-swath survey operations. When they detected a large anomaly, almost certain to be a shipwreck, inside the bullseye of our map, it called for a closer look, and they performed several passes from multiple directions near the target, to image it from as many angles as possible. One image of this shipwreck was astonishing, and seductive. It showed the “sonic shadow of a sidewheel,” cast upon the seabed next to the shipwreck.
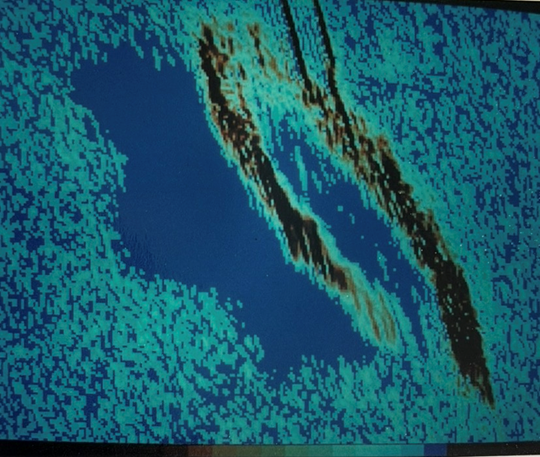
It was designated at first as A2 or Alpha-2, the second anomaly imaged on the first broad-swath trackline, down the center of the highest-probability section of our search plan.
Later, this was called “Sidewheel” in Gary Kinder’s book, Ship of Gold in the deep blue sea. Tommy was obsessed with secrecy, or at least the firm control of information, so colorful nicknames were provided for the book, substituting for our unencrypted alphanumeric names.
As I learned the computer display system and its image processing possibilities, coloring the different signal strengths, I played with a dozen or so of the images taken of A2, from every angle. Williamson and his team had lowered a rudimentary camera sled onto this site at the very end of their contracted 40-day survey. But this was like dangling and lowering a clothespin on the end of fishline into a bottle from the top of a skyscraper. Photographic survey passes over the shipwreck were hit-and-miss. The fuzzy video and still camera photos didn’t reveal much. Anchor chain was the most exciting identifiable feature. To positively confirm the site’s identity as the Central America we were going to need an ROV, a Remotely Operated Vehicle, a robot submarine to explore the site more deftly.
On the strength of its location in the high-probability bullseye, combined with the sidewheel shadow and the two “masts” projecting out of the main structure, at the end of the season the Williamson crew voted a 90% confidence that we had found the S.S Central America.
In 1987, we visited this site with eager anticipation. Our hopes were dashed almost immediately when we saw the previously promising shipwreck with good visual cameras, instead of just sonar images and a couple passes with an unwieldy camera sled. “Ground truthing” the sonar operators call it, and they envied us our opportunity to compare the pictures they made with sonar to what was really there.
But, once we arrived at the site, we found that our proposed dream treasure shipwreck was apparently a burned-out hulk, with the hull’s walls collapsed in such a way as to cast that tantalizing sonic shadow looking so much like a sidewheel. What about the two “masts” that seemed to corroborate the identification of the shipwreck as the Central America? Well, this was another illusion, a long line of anchor chain that trailed out of the middle of the wreck, extending out into the surrounding seabed, and then looping back to the stern.
Tommy, Barry and I huddled to consider our next moves, just as another survey vessel appeared on the horizon. We watched the drama unfold in slow-motion as a nautical pas de deux ensued. We plotted our own position (latitude and longitude,) as well as the range and bearing of the new visitor. Within an hour, this revealed quickly that the mystery vessel was proceeding in a straight line with its speed at around 3 knots. There is no reason for a ship to be doing this in this part of the ocean, unless it is conducting a towed survey. No question about it.
Rivals were looking for the Central America!
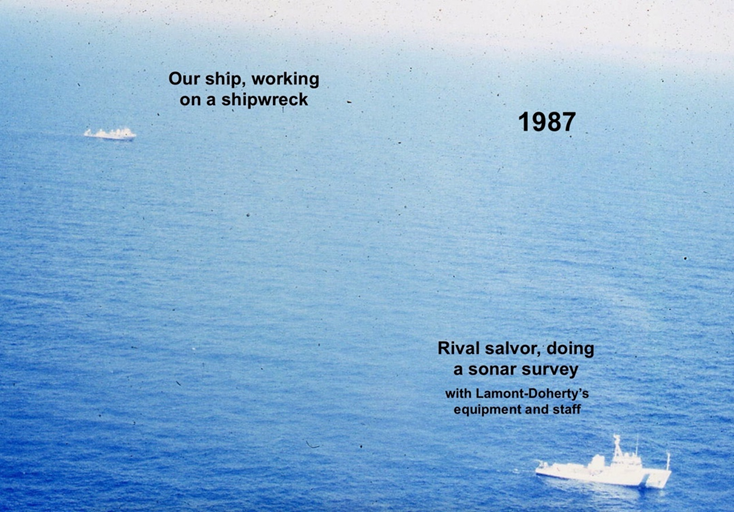
The other ship hailed us by radio. After a brief interchange we learned that this was the M/V (motor vessel) Liberty Star, out of Cape Canaveral, where one of its designed functions was to retrieve the solid rocket boosters ejected into the sea during Space Shuttle launches. Further, when we asked what “entity” they represented, following a similar request from them, they responded that they were, “The Trustees of Columbia University.” This meant that we were faced with a world-class ship staffed with the technical skill and equipment from Lamont-Doherty Geological Institute (now “Lamont-Doherty Earth Institute,”) one of the top oceanographic operations in the world. Wow! Quite a rival!
Goliath had arrived on the scene.
With the collapse of our hopes for site A2, we needed to find out if we had another anomaly that fit the target model. We did gain experience from A2, getting to see first-hand how a wooden hulled ship degrades on our part of the seafloor. We couldn’t quite tell the age of A2. What would be left of the SSCA after 130 years on the bottom?
I had a “Hit Parade” disk (an early forerunner of the optical CD) in my files at sea, and our business-office/communications-shack also housed the same modified IBM XT that I had been using since I learned its functions the year before in Charleston. The Hit Parade was a compilation of all the major “cultural anomalies” imaged during the 1986 survey, everything thought to potentially represent a shipwreck. The XT was slow, and the data was painted one line at a time starting at the bottom of the screen. When the display was filled, the lines scrolled up the screen as new data was added. I scoured the sonagrams that marched up my monitor, searching for a match.
One thing utterly missing from A2 was coal. I expected to find hundreds of tons of coal on the SSCA. What would that look like on a sonagram? Obviously, coal is hard, a rock. Sound should echo loudly when hitting such a surface, producing a bright sonar return signal. Another factor was the ship’s architecture, but we had been fooled by that tantalizing “sidewheel” shadow on A2.
Of the shipwreck anomalies shown in the Hit Parade collection, one stood out as different. Site H, or “Hotel.” The sonar showed a large, central, bright, roughly ship-shaped mass, with long, sinuous bright “tentacles” extending out onto the seabed. It showed no shadow, a real contrast with the previous site. Perhaps it was older and more degraded.
We considered the possibilities. The Central America carried hundreds of tons of coal, since it burned dozens of tons per day as it made long voyages across the ocean. Could the shipwreck be largely gone, except for the coal? There was no shadow here. What about those tentacles extending from the central mass? Were they streams of coal that had spilled out of the hatches during the ship’s long descent to the bottom? We decided that this shipwreck was our best match of any we found in our previous year’s sonar survey. And we had a rival breathing down our neck!
In Treasure Talk Episode 4 Part 1, I briefly covered the legal aspects that accompanied this harrowing month. While our ship remained working over Site H, defending our position, we improvised an air snatch of a lump of coal we recovered. This artifact allowed the Court to grant us a restraining order and an injunction, giving us the rights to work the site undisturbed by others.
While the legal battle raged in court, at sea we were still trying to figure out if we had found the Central America.
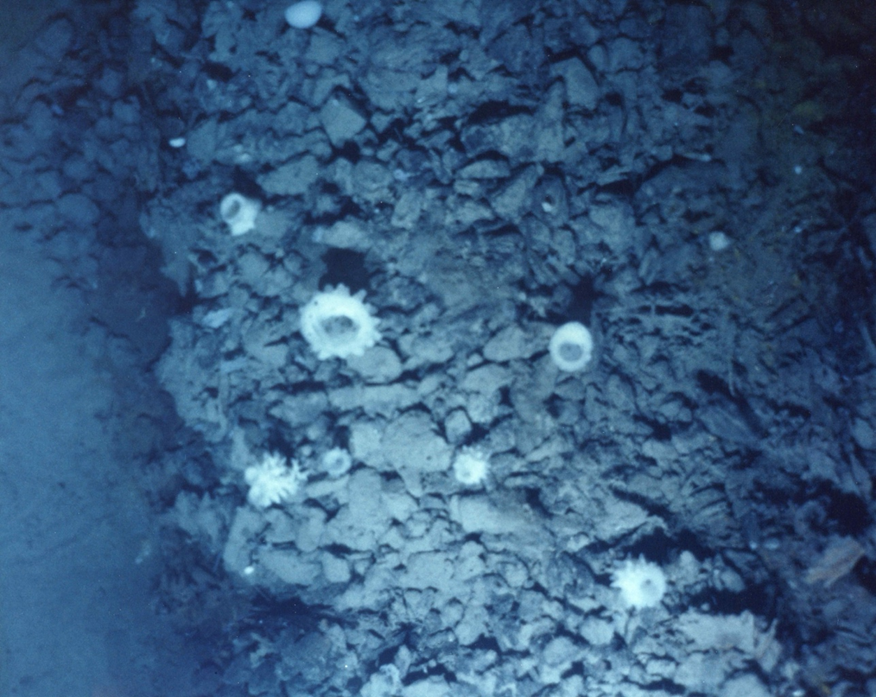
We dove on Site H as the Liberty Star continued its survey lines, which we tracked and plotted, evidence we would present in court. Down below, Nemo’s lights pierced the darkness, and we saw what I expected. Coal. The single most noticeable feature about Site H was the coal. Sponges had colonized heaps of coal.
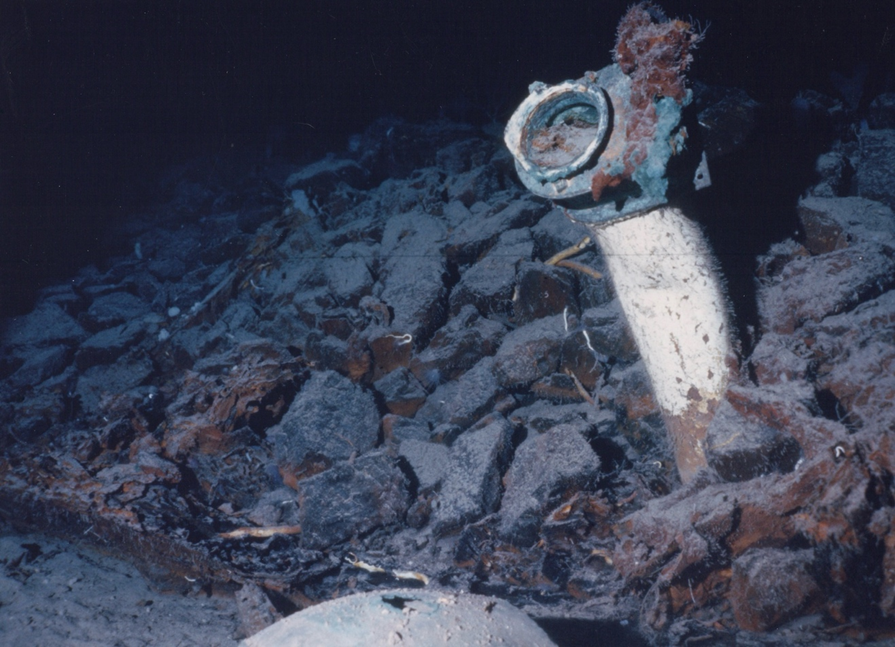
In some places machinery protruded from piles of coal.
We recovered some ceramics from this site, demonstrating further to the Court that we had the ability to work and “possess” the site, important for our injunctive relief. Ceramic objects also offered a chance to date the shipwreck, and possibly confirm the identification, since they did not degrade badly in the corrosive conditions. Large 2-gallon stoneware jugs showed a mixture of changing styles, a transition pointing to the mid-19th century. Then we recovered a white ironstone saucer with a key piece of information.
White ironstone dishes were standard equipment on ships far and wide for a couple centuries. The industrial potteries in Staffordshire cranked out millions of pieces of these plain but sturdy and hard-to-break plates in the pre-plastic era.
On the bottom of the ironstone saucer in question, a curious diamond-shape mark with letters and numbers had been impressed into the piece when it was wet clay. The glaze coating the mark had nearly filled and obscured the weakly applied symbol, but with careful examination the details could be discerned.
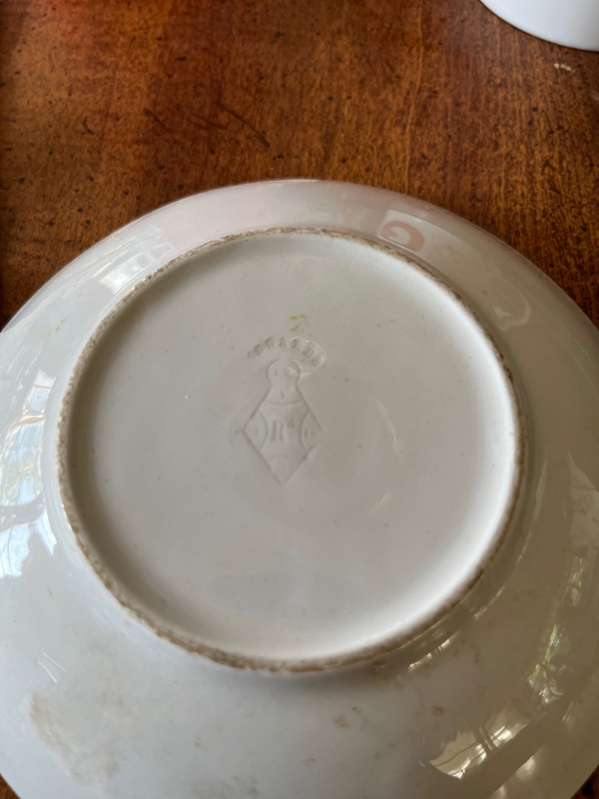
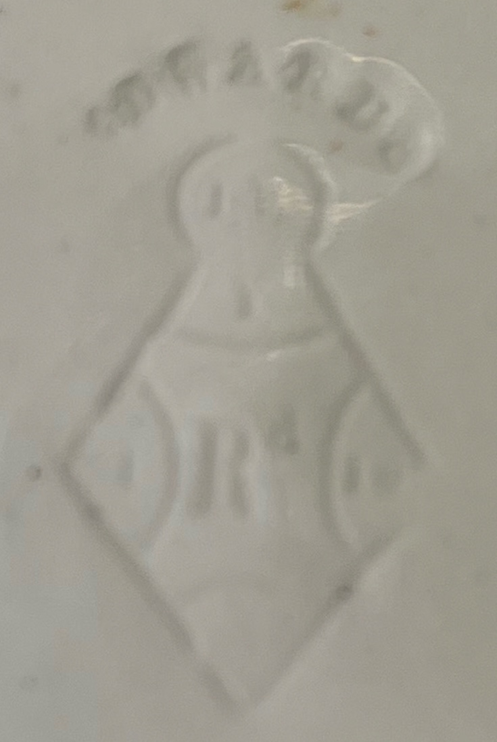
This is an English Registry Mark from the 19th century. It served like a patent or copyright for a design to be used in industrial art. The mark expresses the type of product, plus the year, month, and day that the design was registered with the Crown.
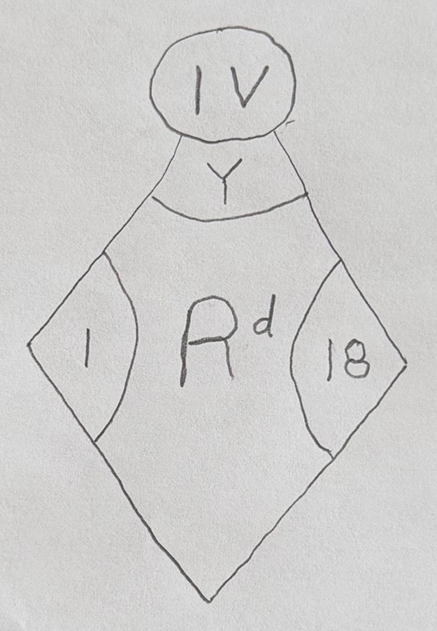
As I read ceramics references and learned about this symbol with its jumbled, non-sequential code, I mused that it was so obtuse that it could have been invented by Tommy Thompson, just to keep secrets.
The maker’s mark is in an arc at the top, “Edwards.”
My own rendering of the symbol.
In the center of the diamond is “Rd” meaning “Registered”
The circular finial at the top of the diamond encloses the letters “IV,” the code for “ceramics,” the type of product.
The top, left, and right vertices of the diamond are, respectively, “Y / I / 18”.
According to the code, Y = 1853, I = July, and 18is the day of the month. The dish’s design was registered July 18, 1853.
On shipwrecks, such marks are like coins, in that they don’t tell you exactly when the ship sank, but they establish an earliest date the sinking could have occurred. “July 18, 1853” looked like a very good match. The SSCA commenced its maiden voyage on October 20, 1853. This saucer could have been part of the original dinner service.
The 1987 season concluded without absolute proof we had found the right shipwreck, and we had not found any gold. But we had prevailed in court and established important legal rights allowing us to work on a site in international waters without interference.
Had we really found it?
More in Part 2…